Hany W Darwish1,2 ![]() ,
Ahmed H Bakheit1,
Ali S Abdelhameed1,
Bakheit Mustafa3
,
Ahmed H Bakheit1,
Ali S Abdelhameed1,
Bakheit Mustafa3
For correspondence:- Hany Darwish Email: hdarwish75@yahoo.com
Received: 17 February 2016 Accepted: 9 April 2016 Published: 27 May 2016
Citation: Darwish HW, Bakheit AH, Abdelhameed AS, Mustafa B. A novel method to determine new potent angiotensin inhibitor, azilsartan, in human plasma via micelle-enhanced spectrofluorimetry using cremophor RH 40. Trop J Pharm Res 2016; 15(5):1003-1012 doi: 10.4314/tjpr.v15i5.15
© 2016 The authors.
This is an Open Access article that uses a funding model which does not charge readers or their institutions for access and distributed under the terms of the Creative Commons Attribution License (http://creativecommons.org/licenses/by/4.0) and the Budapest Open Access Initiative (http://www.budapestopenaccessinitiative.org/read), which permit unrestricted use, distribution, and reproduction in any medium, provided the original work is properly credited..
Purpose: To develop a micelle-enhanced spectrofluorimetric method for the assay of azilsartan (AZL) in bulk form and spiked human plasma without the need for derivatization procedure.
Method: The proposed method was based on studying the fluorescence behavior of AZL in Cremophor RH 40 (Cr RH 40) micellar system. The fluorescence intensity was measured at 371 nm after excitation at 264 nm. The proposed procedure was validated according to International Council on Harmonization (ICH) guidelines.
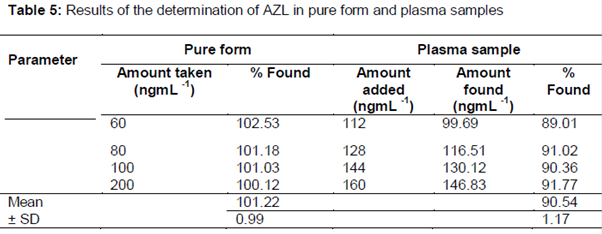
Results: In aqueous solution, the fluorescence intensity of AZL was greatly enhanced by more than 3-fold in the presence of Cr RH 40. The fluorescence –concentration plot was linear over the range of 10 – 500 ng.mL-1, with a limit of detection of 3.287 ngmL-1. The proposed method was successfully applied to the determination of AZL in pure powder form and spiked human plasma. The mean recovery of AZL in spiked human plasma using the proposed method was 90.54 ± 1.17 %.
Conclusion: The suggested method is highly sensitive and simple, and can easily be applied for the quantification of AZL in pure powder form as well as in biological fluids such as plasma.
Introduction
Hypertension affects about 74.5 million individuals in the United States [1]. Despite the availability of antihypertensive agents, hypertension remains inadequately controlled, with slightly less than half of patients who receive medication successfully achieving adequate blood pressure (BP) [2]. While there are many drug classes available to reduce BP, drugs that modulate the renin-angiotensin-aldosterone system (RAAS) are more commonly used because of their efficacy, in addition to their low side effects [3]. Within the RAAS classes, those that inhibit the action of angiotensin II by binding directly to the angiotensin type 1 (AT1) receptor (i.e. angiotensin receptor blockers [ARBs]) are the best tolerated of all antihypertensive drug classes [3].
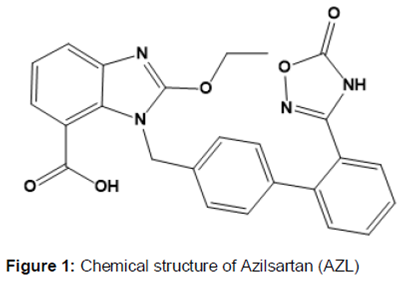
Azilsartan medoxomil is a new ARB developed for management of hypertension. It is a prodrug that is rapidly hydrolyzed to its active moiety, azilsartan (AZL). Chemically, AZL is known as 2-Ethoxy-1-{[2'-(5-oxo-2,5-dihydro-1,2,4-oxadiazol-3-yl)-4-biphenylyl]methyl}-1H-benzimidazole-7-carboxylic acid. The US Food and Drug Administration (FDA) approved Edarbi® tablet (azilsartan medoxomil potassium) on February 25, 2011 to treat hypertension in adults [4]. It is available in 80 mg and 40 mg dosages with the recommended dose of 80 mg daily. Spectrofluorimtric analysis is a very simple, highly sensitive and inexpensive technique that is available at almost all analytical laboratories. The sensitivity of spectrofluorimetry is enhanced by different ways including micellar enhanced approach.
Several micelle-enhanced spectrofluorimetric studies have been reported for the determination of various drugs [5-7]. This fact is due to the ability of the formed micelle to enhance the fluorescence intensity of the weakly fluorescent molecules. Moreover, these procedures represent sensitive and eco-friendly methodology as there is no need for organic solvents. Micellar enhanced analytical methods are relied on addition of surfactants such as sodium dodecyl sulphate (SDS) [7,8], Tween [9,10] and cyclodextrin, etc [11,12]. Nevertheless, using non-ionic surfactant “Cremophor RH 40” is not familiar in the reported methods for determination of drugs. Cremophor RH 40 is manufactured by reacting 40 mol of ethylene oxide with hydrogenated castor oil. It contains mainly the tri-ricinoleate ester of ethoxylated glycerol, with smaller amounts of polyethylene glycol ricinoleate and the corresponding free glycols [13].
A thorough survey of the literature revealed that few reports were published recently for assaying AZL alone in dosage form using high-performance liquid chromatography (HPLC) [14-16], UV spectrophotometry [17], high-performance thin layer chromatography (HPTLC) [14, 18] and in dog and human plasma using LC/MS [19,20]. AZL in combination with chlorthalidone was also determined in dosage form using UV and fluorescence spectrophotometry [21], HPLC [22-25] and in human and rat plasma using LC/MS [26]. Fluorescence spectrometry is a very simple, rapid, efficient, selective, and highly sensitive technique for determination of drug in plasma [27-29]. Therefore, the aim of the current study is to develop and validate a new sensitive, simple and rapid micelle-enhanced spectrofluorimetric method for the in vitro determination of AZL in spiked human plasma. The current procedure does not involve derivatization step due to the intrinsic fluorescent property of AZL.
Methods
Apparatus
Fluorescence measurements were carried out on a fluorescence spectrometer (model FP-8200, Jasco Corporation, Japan) equipped with a 150 W xenon lamp and 1 cm quartz cells. The slit widths for both the excitation and emission monochromators were set at 5.0 nm. The calibration and linearity of the instrument were frequently checked with standard quinine sulphate (0.01 µg/mL). Wavelength calibration was performed by measuring λex at 275 nm and λem at 430 nm; no variation in the wavelength was observed. All recorded spectra converted to ASCII format by SpectraManager® software. A Hanna pH-Meter (Romania) was used for pH adjustments.
Reagents and materials
All the chemicals used were of analytical reagents grade, and the solvents were of HPLC grade. Azilsartan reference standard (purity, ~ 99.6 %) was purchased from Weihua Pharma Co. Ltd (Zhejiang, China). Polyoxyl 40 hydrogenated castor oil (Cremophor RH40), Polyoxyl 35 hydrogenated castor oil (Cremophor EL) were purchased from BASF (Ludwigshafen, Germany) and used as 1 % w/v aqueous solution for Cremophor EL and 1 % v/v aqueous solution for Cremophor EL. Sodium dodecyl sulphate (SDS, 95 %) was purchased from Winlab (UK) and used as 1 % w/v aqueous solution. β–cyclodextrin (β–CD) and carboxymethylcellulose (CMC) were obtained from Merck (Germany) and used as 1 % w/v aqueous solution. Tween–20, tween–80 and tween–85 (Techno Pharmchem Haryana Company (INDIA)), were used as 1 % v/v aqueous solution. Methanol, ethanol (Prolabo, France) and acetonitrile (Sigma-Aldrich Chemie GmbH, Germany). Boric acid, sodium hydroxide, phosphoric acid, potassium chloride, potassium dihydrogen phosphate and disodium hydrogen phosphate were all of spectroscopic grade. Phosphate buffer (0.1 M, pH 2–7), and borate buffer (0.1 M, pH 8–10) solutions were freshly prepared. Ultrapure water of 18 𝜇Ω was obtained from a Millipore Milli-Q® UF Plus purification system (Millipore, Bedford, MA, USA). Human plasma was kindly provided by King Khaled University Hospital (King Saud University, Riyadh, KSA). After informed consent was obtained, fasting blood samples were taken and plasma was separated and stored at -70 °C.
Standard solutions
AZL stock solution (1 mgmL-1) was prepared by dissolving accurately measured amounts of AZL reference standard material in methanol. This solution was found to be stable for several weeks when kept in the refrigerator. A working standard of 20 µgmL−1 was prepared daily by dilution of stock standard solution with methanol.
Construction of the calibration graph
Aliquots of AZL standard solution were transferred into a series of 5 mL volumetric flasks to give final concentrations of 10 - 500 ngmL-1. A volume of 0.9 mL of Cremophor RH40 (Cr RH 40) was added followed by addition of 1 mL of phosphate buffer and diluted to the mark with distilled water. The contents of the flasks were mixed well and the relative fluorescence intensity (RFI) was measured at 371 nm after excitation at 264 nm. RFI was plotted vs. nominal drug concentration (ngmL-1) to obtain the calibration graph. The linear regression equation for the data was computed.
Assay of human plasma samples
Plasma samples were stored at -20 oC and allowed to thaw at room temperature before processing. Twenty microliters of AZL standard solutions of different concentrations (3.2, 3.6, 4.8, 5.4, 6.0 µg/mL) were spiked into 200 µL of human plasma and mixed for 2 min. A volume of 100 µL of phosphate buffer pH 11 was added and the solution was vortexed for 1 min, the volume was then completed to 1.5 mL with methanol and vortexed for other 2 min followed by centrifugation for 20 min at 12000 rpm at room temperature. The supernatant was then transferred and filtered through 0.2 µM syringe filter into glass vials and dried under a gentle stream of nitrogen. Finally, the residues were reconstituted in 50 µL methanol, 900 µL Cr RH 40 and 1 mL phosphate buffer (pH 3.0) and volume was completed to 3 mL with water. A blank plasma sample was treated similarly. RFI was measured at 371 nm after excitation at 264 nm and the concentration of the drug was calculated from the corresponding regression equation.
Results
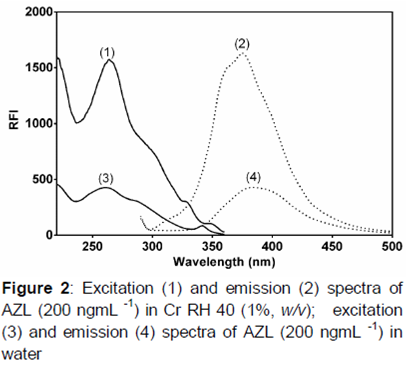
shows the chemical structure of AZL. The fluorescence properties of AZL in both aqueous and Cr RH 40 systems were studied where AZL exhibited an emission band at 371 nm after excitation at 264 nm. illustrates the fluorescence spectra of AZL in the two systems. The first system was aqueous system, while the second was the same aqueous system in the presence of Cr RH 40 as a fluorescence enhancer. The optimum conditions for fluorimetric estimation of AZL were established through number of experiments.
Optimization of experimental conditions
Effect of organized media
The effect of different organized media on the RFI of AZL was studied by adding 0.5 mL, 1 % w/v solution of each surfactant to the drug solution. Different surfactants, like sodium dodecyl sulfate (SDS) [anionic surfactant], Cremophor El, Cr RH 40, carboxymethylcellulose (CMC), tween 80 [nonionic surfactants] and macromolecules such as β-cyclodextrin were tried. The low critical micelle concentration (cmc) values of nonionic surfactants render them better solubilizers for hydrophobic drugs compared to ionic surfactants [30]. As shown in figure 3 three nonionic surfactants, namely Cr RH 40, Cr EL and Tween 20, demonstrated high RFI results for AZL determination.
Effect of volume of nonionic surfactants
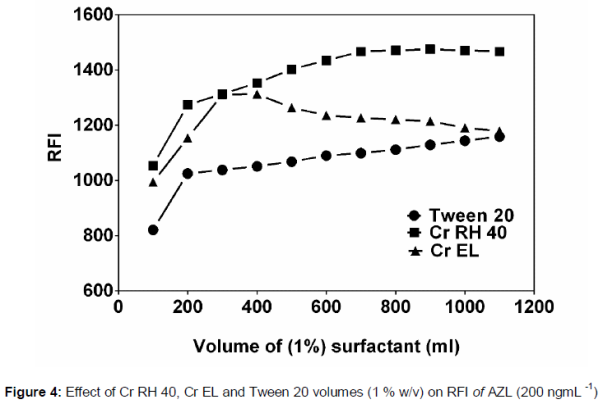
The influence of Cr RH 40, Cr EL and Tween 20, on the RFI of AZL was studied using different volumes of 1 % w/v solutions. On increasing their volumes, Cr RH 40 showed the highest results (). The RFI of AZL using Cr RH 40 increased significantly up to 800 µL (1 % w/v), where after this volume no more significant increase in RFI was observed. Therefore, 900 µL 1 % w/v Cr RH 40 solution was chosen for AZL determination.
Effect of pH
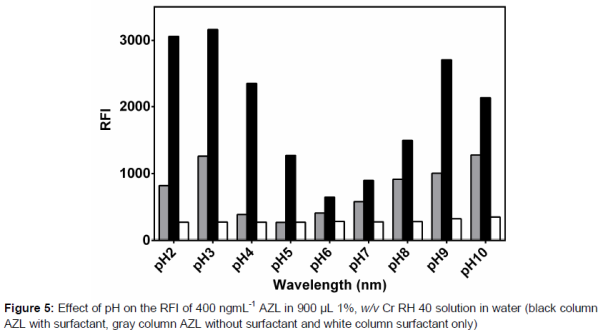
The pH of micellar solutions can display significant influence on the degree of solubilization of some compounds, since it may alter the equilibrium between ionized and nonionized form of these compounds [30]. The effect of pH on RFI of AZL, Cr RH 40 and AZL-Cr RH 40 was examined utilizing different types of buffers covering the whole pH range, for instance 0.1 M phosphate buffer ( cover pH range 2–7) and 0.1 M borate buffer (cover pH range 8–10). Results presented in showed that the optimum pH value for AZL determination with and without Cr RH 40 was 3.
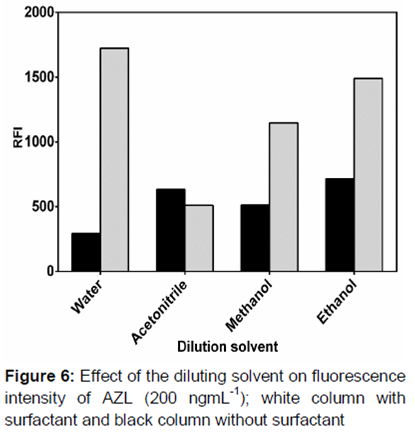
Effect of diluting solvent
Dilution with various solvents such as water, methanol, ethanol and acetonitrile was employed. Water exhibited the highest RFI compared to the other studied solvents (), this may be due to changing the polarity of the medium which in turn may lead to physical interaction between the solvents and the drug molecules. Therefore, water was chosen as the diluting solvent throughout the study. A reduction in the RFI was detected in the micellar system using methanol, acetonitrile or ethanol. This may be attributed to the denaturation of the micelles by short‐chain alcohols such as methanol and ethanol. Furthermore these alcohols may decrease the size of the micelles, and may breakdown the surfactant aggregate at high concentration [31].
Effect of time
The influence of time on the stability of the RFI of AZL in micellar medium was also studied. It was found that the development of RFI was instanteously and persisted stable for at least one hour.
Validation data
The proposed methods were validated according to the ICH-guidelines for validation of the analytical procedures [32] in terms of the linearity, sensitivity, accuracy, specificity, repeatability and reproducibility
Linearity and range
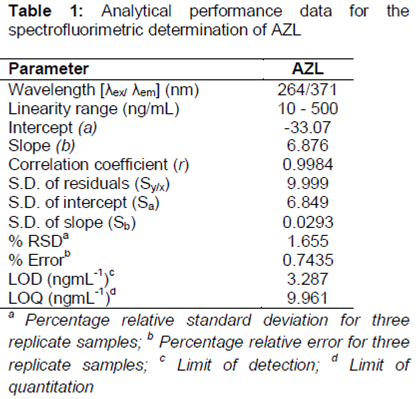
The calibration graph for the determination of AZL by the proposed method was constructed by plotting the RFI versus the concentration. The graph was found to be rectilinear over the concentration range 10-500 ngmL-1 ().
Statistical analysis [33] of the data gave high value of the correlation coefficient (r) of the regression equation, small values of; the standard deviation of residuals (Sy/x), intercept (Sa), slope (Sb), the percentage relative standard deviation and the percentage relative error (). These data proved the linearity of the calibration graph for the studied drug.
Limits of quantitation (LOQ) and of detection (LOD)
Limit of quantitation (LOQ) and limit of detection (LOD) were calculated in accordance with the ICH Q2 (R1) recommendation [32]. LOQ was determined by establishing the lowest concentration that can be measured below which the calibration graph is nonlinear. LOD was determined by evaluating the lowest concentration of the drug that can be detected. The results are also presented in . The values of LOQ and LOD were calculated according to the following equations:
LOD = 3.3 σ/S (1)
LOQ = 10 σ/S (2)
Where, σ was the standard deviation of the intercept of regression line and S was the slope of regression line of the calibration curve. The results are given in .
The reported data in the literature supported that our LOQ (9.961 ngmL-1) is much lower than maximum plasma concentration (Cmax) and hence can easily quantify AZL in plasma (reported Cmax of AZL around 5.7 µgmL-1) [34].
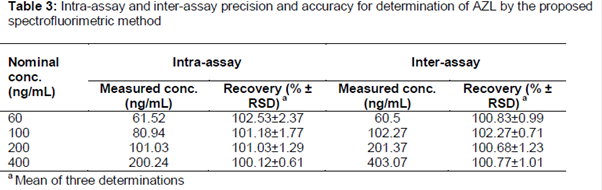
Accuracy and precision
Accuracy, intra-day and inter-day precisions of the proposed method were determined (anticipated in Tables 2 and 3). Three replicate samples in the same day, as well as on three consecutive days were analyzed for intra-day and inter-day precision at different concentrations. Accuracy was calculated as % bias using the following equation,
Bias (%) = [(A-B) × 100]/A……………………. (3)
where A is nominal AZL concentration, and B the measured AZL concentration.
Bias ranged from −3.05 to 0.2 %, thus indicating the high accuracy of the method. The intra-day and inter-day precisions were expressed as recovery (% ± RSD). The average recovery percentages (around 100 %) and the low relative standard deviations (RSD) indicated the inter-day and intra-day precisions of the method ().
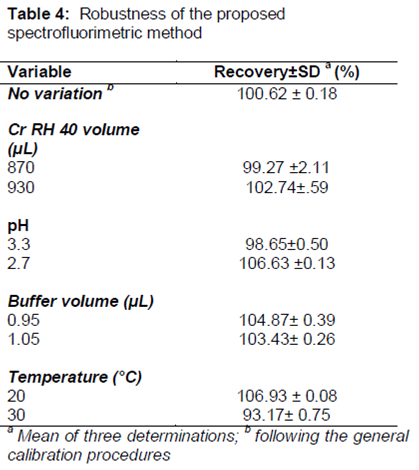
Robustness
Robustness was assessed by testing the susceptibility of measurements to small changes of the analytical conditions. It was found that small differences that may take place during the experimental operation did not significantly change the response (RFI) of the current method. The results are abridged in .
Application of proposed method to analysis of AZL in human plasma
The high sensitivity of the proposed method allowed the determination of AZL in spiked human plasma. AZL is orally bioavailable, reaching peak plasma concentration after 3 of administration. The maximum plasma concentration (Cmax) of AZL is around 5.7 µgmL-1 following oral dose of 80 mg [34]. Therefore vast dilutions were made to reach the dynamic linear range of the current method. Absolute recoveries of AZL in spiked human plasma samples were calculated from its corresponding regression equation. The results abridged in reveal that the % RSD and mean absolute recoveries of AZL in spiked plasma samples are 1.17 % and 90.54 %, respectively. The recovery values are better than those reported by Ramakrishna et al. [26] concerning LC with mass detection for determination of AZL and chlorthalidone in human plasma. Relatively high plasma protein binding of AZL (>99 %) could be responsible for low recovery values (about 91 %).
Discussion
Azilsartan (AZL) possesses weak native fluorescence in aqueous medium. Hence, we intended to enhance this emission band, in order to develop a new and sensitive method for the analysis of AZL in plasma. It became known that adding a surfactant at a concentration greater than its critical micellar concentration to a given fluorophore solution increases the molar absorptivity and/or the fluorescence quantum yield of the fluorophore in many circumstances [7,35]. This fact has been used to increase the performance of spectrofluorimetric methods of various analytes. The fluorescence behaviour of AZL in various micellar media was studied and there was an enhancement about 300 % of the RFI in the presence of Cr RH 40 system under the optimum above mentioned conditions.
For exploring whether the enhancement of AZL fluorescence was due to rise in quantum yield or due to increment of absorbance of AZL at λex; the molar absorptivity of AZL in Cr RH 40 (εmicellar) was calculated at 264 nm (λex). The εmicellar/εacetonitrile ratio was unity which indicated that the increase in sensitivity is not affected by an increase in the absorption of the drug in micellar system at its λex. The increase in the quantum yield of AZL in Cr RH 40 was produced by protection of the lowest excited singlet state from non-radiative processes in the micellar system. The quantum yield of AZL was found to be 0.249 in methanol and 0.628 in the presence of Cr RH 40. The quantum yield was calculated according to the following equation [36]:
Ød = Øq (Fd/Fq).(Aq/Ad)……………………… (4)
where Ød and Øq referred to the fluorescence quantum yields of AZL and quinine, respectively; Fd and Fq represent the integral fluorescence intensities of AZL and quinine, respectively; Ad and Aq referred to the values of absorbance of the drug and quinine at the excitation wavelength, respectively. The concentration was selected so that the absorbance was less than 0.05 to reduce the error arising from the inner effect [37].
Conclusion
A simple and sensitive spectrofluorimetric method was developed for the determination of AZL through enhancement of its native fluorescence. The suggested method is simple, less time consuming and does not require the elaborate treatment associated with chromatographic methods; moreover, it is sensitive and no need for derivatization reaction. By virtue of its simplicity, rapidity and sensitivity, the proposed method can be applied for the analysis of the AZL in spiked human plasma.
Declarations
Acknowledgement
References
Archives


News Updates